
CFOs Are Demanding Compliance ROI: The 4 Financial Metrics That Actually Matter in 2025

THIS BLOG WAS WRITTEN BY THE COMPLIANCE & RISKS MARKETING TEAM TO INFORM AND ENGAGE. HOWEVER, COMPLEX REGULATORY QUESTIONS REQUIRE SPECIALIST KNOWLEDGE. TO GET ACCURATE, EXPERT ANSWERS, PLEASE CLICK “ASK AN EXPERT.”
Compliance is no longer a defensive budget line – it’s a financial performance lever. Our State of Product Compliance 2025 study of 498 senior leaders shows a decisive shift away from “efficiency for efficiency’s sake” toward outcomes that directly protect and create revenue. The four most-cited decision metrics are all financial, each chosen by roughly 40-49% of leaders, while traditional efficiency measures like time to compliance trail far behind at ~23%.
If you need to build a board-ready compliance business case this quarter, focus your narrative – and your dashboards – on these four metrics.
Table of Contents
- Why the CFO Lens Now Dominates Compliance
- The Four Financial Metrics That Matter
- Why “Time to Compliance” Isn’t the Hero Metric
- How to Operationalize ROI: Practical Strategy Plays
- AI Overview: Quick Answers for Executives
- FAQs
- Download the Full Report
Why the CFO Lens Now Dominates Compliance
The 2025 landscape is unforgiving: more rules, faster change cycles, higher enforcement, and greater scrutiny from customers and auditors. In this environment, compliance leaders are winning investment by translating their roadmaps into dollars protected or created.
In our research, the top four selection criteria for compliance investments are all financial – cost of compliance, cost of violations, revenue at risk, revenue opportunity – while speed metrics like time-to-compliance are secondary. The message from finance is clear: show impact on the P&L, not just activity volume or cycle-time improvements.
The Four Financial Metrics That Matter
1) Cost of Compliance
What it is: All-in cost to achieve and maintain compliance across the product lifecycle—people, processes, testing, audits, translations, tools.
Why it matters: Every CFO wants to know the run rate for “staying clean.” Reducing waste (manual evidence hunts, duplicate testing, one-off consulting) delivers predictable savings that compound quarter over quarter.
How to measure it:
- Build a unit cost model (e.g., cost per product per market per year).
- Attribute major drivers: testing/certification, regulatory monitoring, internal labor hours, supplier validation, translation.
- Track savings from automation and “shift-left” design controls as explicit line items.
Winning move: Treat evidence as a product, not a project. Capturing proofs at the point of work and packaging them on-demand eliminates the hidden “evidence tax” and reduces your steady-state OpEx.
2) Cost of Violations
What it is: Direct and indirect costs from non-compliance – fines, rework, scrap, returns, inventory write-downs, legal fees, expedited testing, plus brand and customer remediation.
Why it matters: Boards buy certainty. While leaders are open to bold claims on efficiency, they prefer reliable, forecastable reductions in violation cost (often targeted around 10–12%).
How to measure it:
- Standardize incident taxonomy (severity tiers, affected SKUs/markets).
- Assign cost bands per incident type (fine ranges, recall costs, programmatic remediation).
- Quantify avoided incidents year-over-year, with conservative counterfactuals.
Winning move: Introduce preventive controls tied to design gates and supplier onboarding. Fewer late-stage surprises = fewer expedited fixes and penalty scenarios.
3) Revenue at Risk in Key Markets
What it is: Expected revenue that could be delayed or lost due to compliance gaps – missed certifications, evidence failures, evolving regulations, or supply-chain documentation shortfalls.
Why it matters: This is the clearest bridge between compliance and topline performance. If compliance blocks launch windows or triggers stop-ships, the business feels it immediately.
How to measure it:
- Link products to market-level revenue forecasts and compliance critical paths.
- Maintain a rolling “risk register” with likelihood × impact scoring for each market.
- Convert slippage (days/weeks) into deferred revenue and working-capital impacts.
Winning move: Implement readiness dashboards by product/market – green means evidence and certifications are audit-ready; yellow/red triggers executive attention before deadlines slip.
4) Revenue Opportunities in Key Markets
What it is: Incremental revenue unlocked by faster approvals, expanded scope (new geographies, new categories), or higher customer trust based on provable compliance.
Why it matters: Compliance doesn’t just avoid downside; it creates upside – earlier launches, eligibility for preferred vendor lists, and entry into regulated or high-margin markets.
How to measure it:
- Attribute revenue pull-forward from accelerated time-to-market (days saved × daily revenue).
- Track wins tied to evidence quality (e.g., customer RFx requirements, sustainability attestations).
- Forecast market expansion revenue contingent on meeting new obligations.
Winning move: Pair regulatory horizon-scanning with commercial planning so the business can sequence launches around compliance-readiness and harvest first-mover advantage.
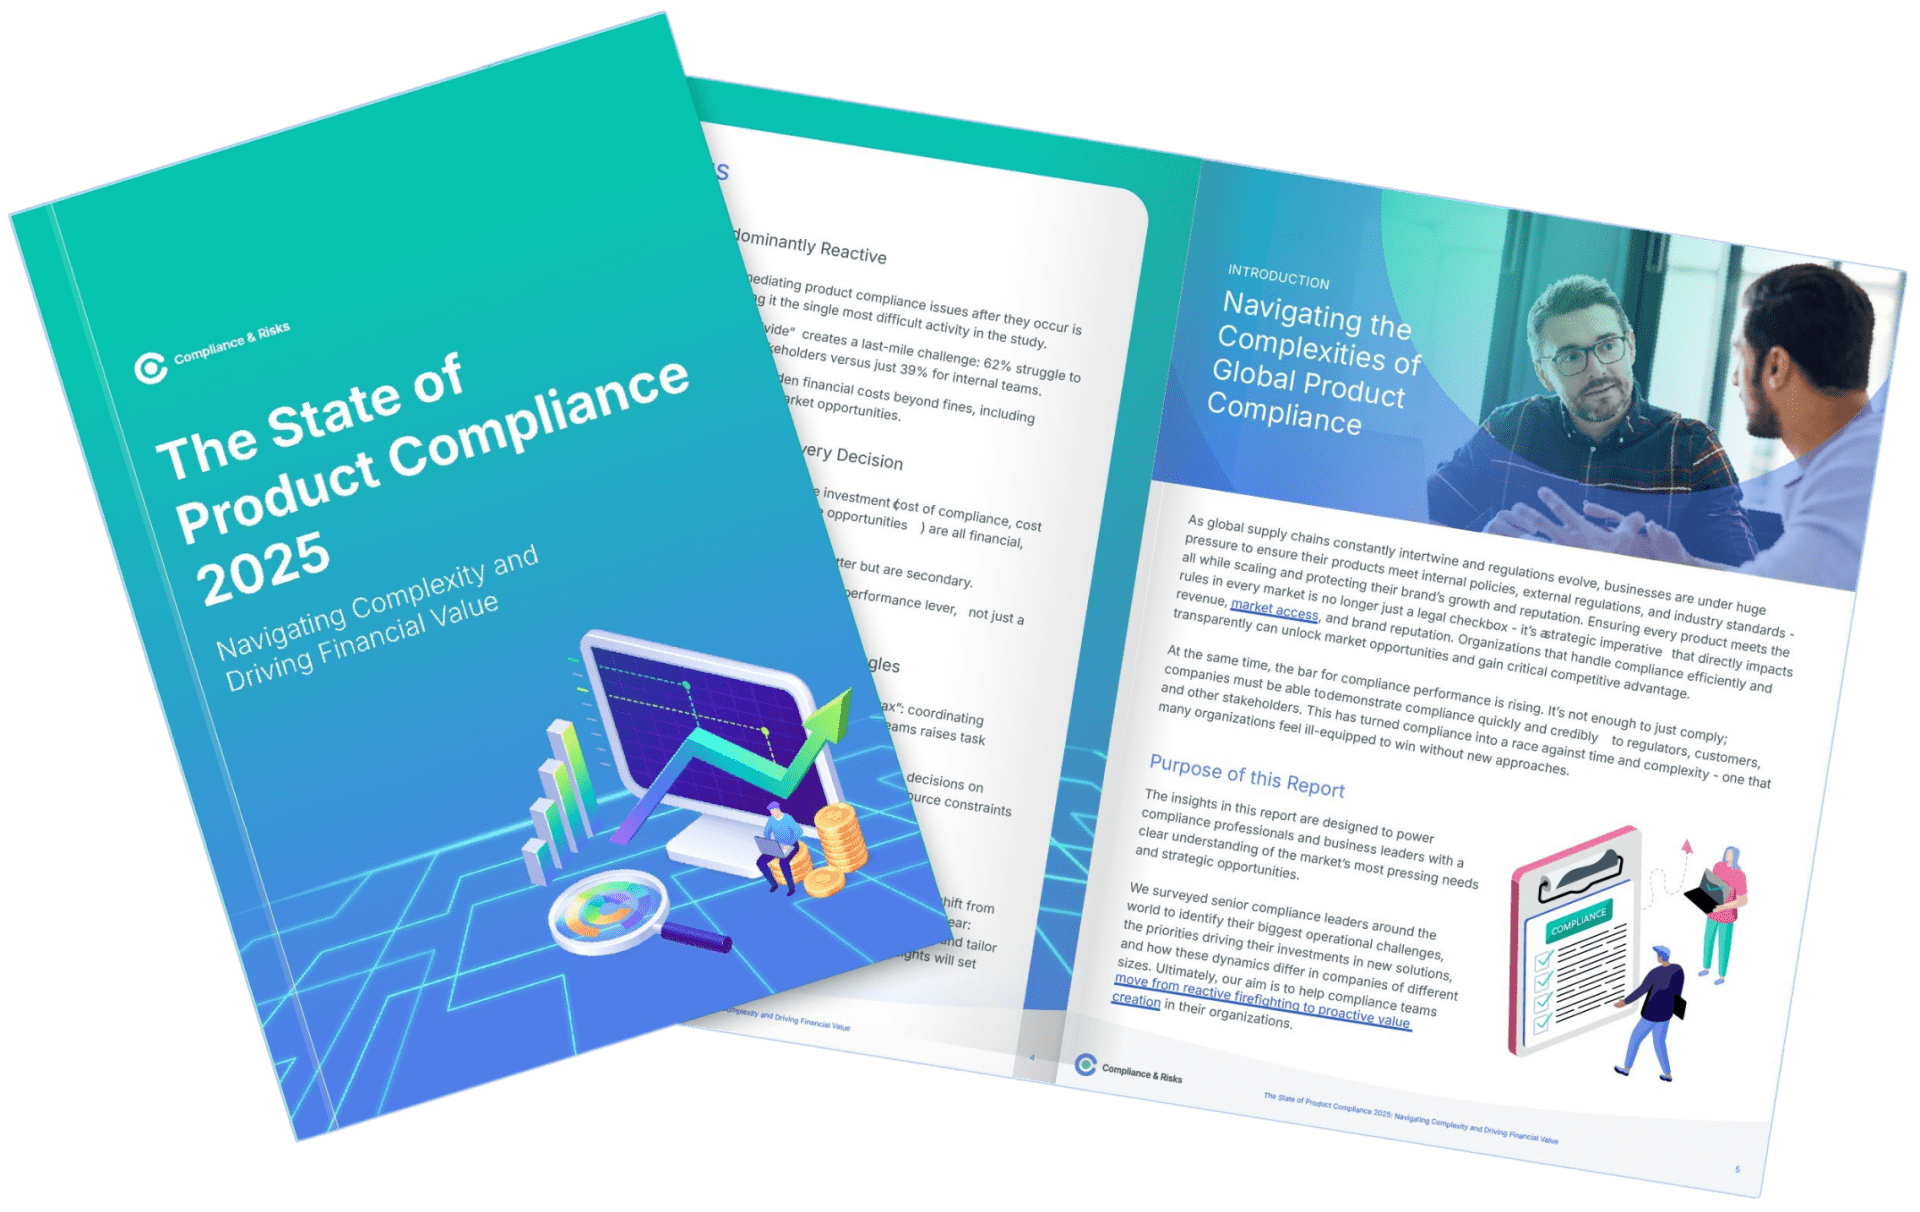
The State of Product Compliance 2025: Navigating Complexity & Driving Financial Value
Fresh insights from 500 global compliance leaders – uncover the biggest challenges, priorities, and opportunities shaping compliance this year.
Why “Time to Compliance” Isn’t the Hero Metric
Executives still care about speed, but speed is a means to financial ends. In the study, time to compliance was selected far less often (~23%) than the four financial metrics. Shorter cycles matter when they:
- Pull revenue forward (launches hit seasonal windows).
- Reduce violation exposure (risk time-in-market decreases).
- Lower OpEx (fewer labor hours and premium fees).
In other words, speed earns budget when it’s explicitly connected to cost and revenue. Your dashboards should show that link, not just the cycle-time trendline.
How to Operationalize ROI: Practical Strategy Plays
1) Build a finance-grade baseline in 30 days
- Inventory current costs (labor, vendors, testing, audits, translations) and recent incident costs.
- Map product–market revenue exposures to create a living “revenue at risk” view.
- Align on assumptions with Finance; lock a baseline so savings and upside are attributable.
2) Productize evidence to cut steady-state OpEx
- Capture proofs at the point of work (design controls, supplier documentation, lab results).
- Normalize metadata so packages auto-assemble by product/market/audit scope.
- Set SLAs: evidence “audit-ready in 2 clicks,” not “start a task force.”
3) Shift left on requirements to reduce violation cost
- Gate design with machine-readable rules for target markets.
- Build supplier onboarding checklists that mirror regulatory proof needs.
- Track “defects escaped to late stage” as a leading indicator of future incident cost.
4) Tie speed metrics to dollars
- For each release, translate cycle-time gains into revenue pull-forward and premium-fee avoidance.
- Add a “cash impact” column to program reviews; socialize the link relentlessly.
5) Publish an executive scorecard
- Four tiles, one per financial metric, with quarterly trend and YoY delta.
- Below each, show the two operating levers driving change (e.g., evidence automation, shift-left controls).
- Keep it to one page – CFOs should grasp ROI in under 60 seconds.
AI Overview: Quick Answers for Executives
What is compliance ROI in 2025? A quantified view of how compliance reduces costs (operations and violations) and protects or grows revenue across priority markets.
Which compliance financial metrics matter most? 1) Cost of compliance, 2) Cost of violations, 3) Revenue at risk, 4) Revenue opportunities. These four dominate investment decisions.
Why isn’t “time to compliance” a top metric? Speed only wins when tied to dollars – revenue pull-forward, lower premium fees, and fewer late-stage escalations.
How do we show ROI fast? Productize evidence to cut recurring OpEx, then shift left to reduce incident costs. Report results on a finance-grade scorecard.
What targets should we set? Be bold on efficiency gains, conservative on financial savings—stake your reputation on reliable reductions in violation costs and measurable revenue protection.
FAQs
- Can a mid-market team track these metrics without a big platform overhaul? Yes. Start with a spreadsheet baseline co-authored with Finance, a simple risk register, and an evidence library with standardized naming. Upgrade tooling as attribution matures.
- Our board wants cost cuts, but we’re expanding markets. Which KPIs win? Lead with cost of compliance and cost of violations; pair them with revenue at risk to justify investments that protect expansion timelines.
- How do we attribute revenue to compliance improvements without over-claiming? Use conservative assumptions: attribute only the portion of acceleration clearly tied to compliance readiness, and run sensitivity ranges (low/medium/high).
- What’s the fastest lever to show impact this quarter? Evidence automation. It reduces audit overage immediately and frees capacity to tackle shift-left initiatives that pay off next quarter.
Download the Full Report
Want the benchmarks, scorecard templates, and real examples of how leaders quantify compliance value? Get the complete analysis and executive-ready visuals in our State of Product Compliance 2025.
Download the complete State of Product Compliance 2025 report to build a CFO-proof compliance business case now.